- DCCN HPC Guide
- Introduction
- 1. Linux Basic
- 2. Bash scripting
- 3. Using the HPC Cluster
Running computations on the Torque cluster
What is the Torque cluster?
The Torque cluster is a pool of high-end computers (also referred to as execute hosts) managed by a resource manager called Torque and a job scheduler called Maui. Instead of allowing users to login to one computer and run computations freely, user submit their computations in forms of jobs to the Torque cluster. A sketch in the picture below summarises how jobs are being managed by the Torque server and scheduled by its companion, the Maui server, to perform computations on the execute hosts in the cluster.
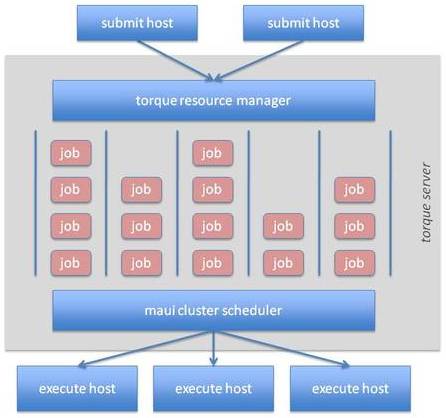 Every job is submitted to the Torque cluster with a set of resource requirement (e.g. duration of the computation, number of CPU cores, amount of RAM, etc.). Based on the requirement, jobs are arranged internally in job queues. The Maui scheduler is responsible for prioritising jobs and assign them accordingly to execute hosts on which the jobs' requirements are fulfilled. The system also guarantees dedicated resources for the computation. Thus, interference between different computations is minimised, resulting in more predictable job completion time.
Resource sharing and job prioritisation
For optimising the utilisation of the resources of the Torque cluster, certain resource-sharing and job prioritisation policies are applied to jobs submitted to the cluster. The implications to users can be seen from the the three aspects: job queues, throttling policies for resource usage and job prioritisation.
Job queues
In the cluster, several job queues are made available in order to arrange jobs by resource requirements. Those queues are summarised in the table below. Queues are mainly distinguished by the wall time and memory limitations. Some queues, such as matlab, vgl and interactive, have their own special purpose for jobs with additional resource requirements.
| queue name | routing queue | walltime limit | memory limit | special requirement | job priority |
|---|---|---|---|---|---|
| matlab | N/A | 24 hours | 256 GB | matlab license | normal |
| vgl | N/A | 8 hours | 10 GB | VirtualGL capability | normal |
| short | N/A | 2 hours | 8 GB | normal | |
| veryshort | N/A | 20 minutes | 8 GB | normal | |
| long | automatic | 24 hours | 64 GB | normal | |
| batch | automatic | 48 hours | 256 GB | normal | |
| verylong | automatic | 72 hours | 64 GB | normal | |
| interactive | automatic | 72 hours | 64 GB | user interaction | high |
At the job submission time, user can specify to which queue the job should be placed in the system. Alternatively, one could simply specify the wall time and memory required by the job and let the system pick up a most proper queue automatically for the job. The second approach is implemented by the automatic queue behaving as a router to a destination queue.
Throtteling policies for resource usage
Based on the job queue, throttling policies are applied to limit the amount of resources an user can allocate at the same time. It is to avoid resources of the entire cluster being occupied by a single user. This is mainly achieved by limiting the total number of runnable (i.e. the jobs occupying resources to perform computations) and queue-able (i.e. the jobs waiting in the queue for resources to be available) jobs per user. The table below summarises the settings for different job queues.
| queue name | max. runnable jobs | max. queue-able jobs |
|---|---|---|
| matlab | 220 | 2000 |
| short | 220 | 2000 |
| veryshort | 220 | 2000 |
| long | 220 | 2000 |
| batch | 220 | 2000 |
| verylong | 220 | 2000 |
| vgl | 2 | 5 |
| interactive | 2 | 2 |
For most of queues, the number of runnable and queue-able jobs are set to 220 and 2000, respectively. However, they are more restricted for the vgl and interactive queues. For jobs in the vgl queue, the maximum runnable and queue-able jobs are set to 2 and 5, respectively; while they are 2 and 2 for jobs in the interactive queue. This is to compensate for the facts that vgl jobs consume lots of the network bandwidth; and interactive jobs always have the highest priority to start.
In addition, the total amount of resources a single user can occupy in the cluster is limited to an equivalent of 1440 walltime hours. It implies that, for example, if your job requests 12 hours of the wall time, the total number of such type of jobs to run concurrently in the cluster will be limited to 120 instead of 220.
Job prioritisation
Job priority determines the order of waiting jobs to start in the cluster. Job priority is calculated by the Maui scheduler taking into account various factors. In the cluster at DCCN, mainly the following three factors are considered.
- The waiting time a job has spent in the queue: this factor will add one additional priority point to jobs waiting for one additional minute in the queue.
- Queue priority: this factor is mainly used for boosting jobs in the interactive queue with an outstanding priority offset so that they will be started sooner than other types of jobs.
- History of personal resource utilisation (fairshare): this factor takes into account the resource utilisation history and puts a penalty (i.e. negative priority points) on the jobs belong to users who have been overusing the defined resource utilisation target.
The final job priority combining the three factors is used by the scheduler to order the waiting jobs accordingly. The first job in the order is the next to start in the cluster.
Note: Job priority calculation is dynamic and not complete transparent to users. One should keep in mind that the cluster does not treat the jobs as "first-come first-serve".
Job management workflow
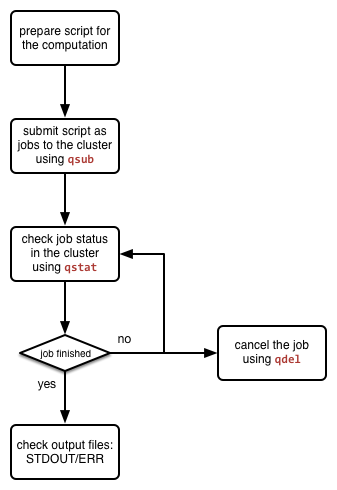 The Torque system comes with a set of command-line tools for users to manage jobs in the cluster. These tools are generic and can be utilised for running various types of analysis jobs. The picture on the left shows a general job management lifecycle when running your computations in the cluster. The three mostly used tools during the job management lifecycle are:
 qsub for submitting jobs to the cluster, qstat for checking jobs' status in the cluster, and qdel for cancelling jobs. The usage of them are given below.
Batch job submission
The qsub command is used to submit jobs to the Torque job manager. The first and simplest way of using qsub is pipelining a command-line string to it. Assuming that we want to display the hostname of the execute host on which the job will run, we issue the following command:
$ echo '/bin/hostname -f' | qsub -l 'procs=1,mem=128mb,walltime=00:10:00'
Here we echo the command we want to run (i.e. /bin/hostname -f) as a string, and pass it to qsub as the content of our job. In addition, we also request for resources of 1 processor with 128 megabytes RAM for a walltime of 10 minute, using the -l option.
In return, you will receive an unique job identifier similar to the one below.
6278224.dccn-l029.dccn.nl
It is "the" identifier to be used for tracing the job's progress and status in the cluster. We will show it later; for the moment, we continue with a different way of using the qsub command.
It is more realistic that our computation involves a set of commands to be executed sequentially. A more handy way is to compose those commands into a bash script and hand the script over to the qsub command. Assuming we have made a script called my_analysis.sh right in the present working directory (i.e. PWD), we can then submit this script as a job via the following command:
$ qsub -l 'procs=1,mem=128mb,walltime=00:10:00' ${PWD}/my_analysis.sh
It is very often that the same analysis needs to be repeated on many datasets, each corresponds to, for example, a subject. It would be smart to implement the bash script with additional arguments to switch between datasets. Assuming that the my_analysis.sh is now implemented to take one argument as the subject index, submitting the script to run on the dataset of subject \texttt{001} would look like the example below:
$ echo "${PWD}/my_analysis.sh 001" | qsub -N 's001' -l 'procs=1,mem=128mb,walltime=00:10:00'
Note: the command above for passing argument to script is actually a workaround as qsub (of currently installed version) does not provide options to deal with the command arguments.
Interactive computation in text mode
It is possible to acquire a Linux shell of an execute host for running computations interactively. It is done by submitting the so-called interactive jobs. To submit an interactive job, one adds an additional -I option of the qsub command:
$ qsub -I -l 'procs=1,mem=128mb,walltime=00:10:00,mem=128mb'
In few seconds, a message similar to the one below will show up in the terminal.
The shell prompt on line 14 shows that you are now logged into an execute host (i.e. dccn-c351). You can now run the computation interactively by typing a command after the prompt.
Note: the resource usage of interactive job is also monitored by the Torque system. The job will be killed (i.e. you will be kicked out the shell) when the computation runs over the amount of the resources requested at the job submission time.
Interactive computation in graphic mode
Inteactive computation in graphic mode is actually achieved by submitting a batch job to run the graphical application on the execute node; but when the application runs, it shows the graphic interface remotely on the cluster's access node. Therefore, it requires you to connect to the cluster's access node via VNC.
Assuming we want to run FSL interactively through its graphical menu, we use the following commands:
$ xhost +
$ echo "export DISPLAY=${HOSTNAME}${DISPLAY}; fsl" | qsub -q interactive -l 'procs=1,mem=128mb,walltime=00:10:00'
The first command allows graphic interfaces on any remote host to be displayed on the access node. The second command submit a job to firstly set the execute host to forward graphic interfaces to the access node before launching the FSL executable.
Checking job status
Every submitted job in the cluster is referred by an unique identifier (i.e. the job id). It is "the" reference allowing system and users to trace the progress of a particular job in the cluster. The system also maintains a set of historical jobs (i.e. jobs finished in last 12 hours) that can be also queried by users using the qstat command.
To get a list of jobs submitted by you, simply run
$ qstat
If you have jobs in the system, you will get a table similar to the one below:
job id                    Name             User            Time Use S Queue
------------------------- ---------------- --------------- -------- - -----
6318626.dccn-l029          matlab           honlee          00:00:00 C matlab
6318627.dccn-l029          matlab           honlee          00:00:00 C matlab
6318630.dccn-l029          STDIN            honlee          00:00:01 C matlab
6318631.dccn-l029          STDIN            honlee          00:00:01 C interactive
In the able, the colume Time Use indicates the CPU time utilisation of the job, while the job status is presented in the column S with a flag of a capital letter. Possible job-status flags are summarised below:
- H: job is held (by the system or the user),
- Q: job is queued and eligible to run,
- R: job is running,
- E: job is exiting after having run,
- C: job is completed after having run.
Tip: there are many options supported by qstat. For example, one can use -i to list only jobs waiting in the queue. More options can be found via the online document using man qstat.
Cancelling jobs
Cancelling jobs in the cluster is done with the qdel command. For example, to cancel a job with id 6318635, one does
$ qdel 6318635
Note: you cannot cancel jobs in status exiting (E) or completed (C).
Output streams of the job
On the execute host, the job itself is executed as a process in the system. The default STDOUT and STDERR streams of the process are redirected to files named as <job_name>.o<job_id_digits> and <job_name>.e<job_id_digits>, respectively. After the job reachers the complete state, these two files will be produced on the file system.
Tip: the STDOUT and STDERR files produced by job usually provide useful information for debugging issues with the job. Always check them first when your job is failed or terminated unexpectedly.
Estimating resource requirement
As we have mentioned, every job has attributes specifying the required resources for its computation. Based on those attributes, the job scheduler allocates resources for jobs. The more precise these requirement attributes are given, the more efficient the resources are used. Therefore, we encourage all users to estimate the resource requirements before submitting massive jobs to the cluster.
The walltime and memory requirements are the most essential ones amongst others. Hereafter are three different ways to make estimations of those two requirements.
Note: Computing resources in the cluster are reserved for jobs in terms of size (e.g. amount of requested memory and CPU cores) and duration (e.g. the requested walltime). Under-estimating the requirement causes job to be killed before completion and thus the resources have been consumed by the job were wasted; while over-estimating blocks resources from being used efficiently.
Consult your colleages
If your analysis tool (or script) is commonly used in your research field, consulting with your colleagues might be just an efficient way to get a general idea about the resource requirement of the tool.
Use the job's epilogue message
Proper estimation of the wall time and memory requirements can be determined with a trial procedure in which the user submits a test job to the cluster with a rough requirement. If the rough requirement is not sufficient to allow the job to finish, the job will get killed with an e-mail notification. In the job's STDOUT file (i.e. <job_name>.o<job_id_digits>), you will see an Epilogue message stating the amount of resources being used by the job. In the snippet below, this is shown on line 9.
Adjust the rough requirement gradually based on the usage information and resubmit the test job with the new requirement. In few iterations, you will be able to determine the actual usage of your analysis job. A rule of thumb for specifying the resource requirement for the production jobs is to add on top of the actual usage a 10~20% buffer as a safety margin.
Monitor the resource consumption
Another way of estimating the wall time and memory requirement is to monitor the usage of them at run time. This approach only feasible if you run the test job interactively through a graphical interface. The monitor of the resource utilisation is provided by two graphical tools: cluster-meminfo and cluster-walltimeinfo for memory and wall time utilisation, respectively. Under the hood, these two tools use actually the qstat -f command to query the up-to-date resource usage from the torque system. Use the following commands to launch the monitoring tools in your interactive job:
$ cluster-meminfo
$ cluster-walltimeinfo
Cluster tools
A set of auxiliary scripts is developed to ease the job management works on the cluster. Those tools are listed below with brief description about their functionalities. To use them, simply type the command in the terminal. You could try to apply the -h or --help option to check if there are more options available.
| Command | Functionality |
|---|---|
pbsnode |
lists the execute hosts in the cluster. It is one of the Torque client tools. |
cluster-qstat |
lists recently submitted jobs from all system users. |
cluster-info |
lists system utilisation metrics of the access nodes and the mentat compute nodes. |
cluster-status |
lists system utilisation metrics of the exectue hosts in the Torque cluster. |
cluster-torqueconfig |
displays the cluster's settings. |
cluster-fairshare |
displays the fairshare information used by the Maui scheduler in prioritising jobs. |
cluster-meminfo |
monitors the amount of memory has been consumed by the job. |
cluster-walltimeinfo |
monitors the remaining walltime the job can still run. |
cluster-matlab |
displays the matlab license useage. |
cluster-vncserver |
lists all VNC servers running on the access nodes and the mentat compute nodes. |
Labs
We are going to create a script that will run the sleep command for a given duration, and submit the script as jobs to the cluster.
make a script called
run_sleep.shwith the following content:#!/bin/bash my_host=$( /bin/hostname ) time=$( date +%s ) echo "$time: $my_host falls to sleep ..." sleep $1 time=$( date +%s ) echo "$time: $my_host wakes up."- make sure the script runs locally
$ chmod +x run_sleep.sh $ ./run_sleep.sh 1 1412674030: mentat001.dccn.nl falls to sleep ... 1412674031: mentat001.dccn.nl wakes up. - submit a job to sleep for 60 second
$ echo "$PWD/run_sleep.sh 60" | qsub -N 'sleep_1m' -l 'procs=1,mem=10mb,walltime=00:01:30'
 6928945.dccn-l029.dccn.nl
check the job status until it is complete
$ watch qstat 6928945Tip: the
watchutility is used here to repeat theqstatcommand every 2 seconds. PressCtrl-cto quit thewatchprogram when the job is finished.- examine the output file, e.g.
sleep_10.o6928945to find out the resource consumption of this job$ cat sleep_1m.o6928945 | grep 'Used resources' Used resources: cput=00:00:00,mem=4288kb,vmem=433992kb,walltime=00:01:00